
-
Weather
Current conditionsGlobal map Metar World weather Hurricanes Metar weather Global snow Lightning 
Antarctica
GrLevelX


Base Reflectivity (BR)
Reflectivity is the amount of transmitted power returned to the radar receiver after hitting precipitation, compared to a reference power density at a distance of 1 meter from the radar antenna.
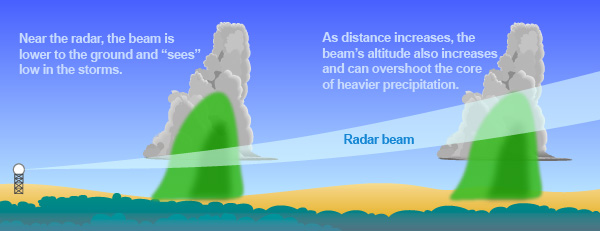
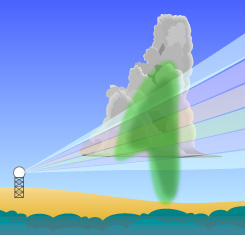
Base reflectivity only shows reflected energy at a single elevation scan of the radar. Taken from the lowest (½°) elevation scan, base reflectivity is excellent for surveying the region around the radar to look for precipitation. However, remember the radar beam increases in elevation as distance increases from the radar. This is due, in part, to the elevation angle itself but is more because the earth's surface curves away from the beam. This can lead to underestimating the strength and intensity of distant storms. For this reason, it is wise to always check the radar images from different locations to help provide the overall picture of the weather in any particular area. The colors represent the strength of returned energy to the radar expressed in values of decibels (dBZ). These dBZ values equate to approximate rainfall rates.
|
|
|||||||||||||||||||||||||||||||||||
Composite Reflectivity (CR)
|
The strongest returned energy for each elevation angle in a volume scan is compiled into one image called, simply, composite reflectivity. Whereas the base reflectivity image is the first image available during a volume scan, the composite reflectivity image is one of the last views necessitated by the need for all elevation scans to be completed before this image can be produced. When compared with Base Reflectivity, the Composite Reflectivity can reveal important storm structure features and intensity trends of storms. This is important because often during the development of strong to severe thunderstorms, rain-free areas (or areas with light rain) develop as a result of strong updrafts. |
Base Velocity (BV)
Base Velocity images provides a picture of the basic wind field from the ½° elevation scan. It is useful for determining areas of strong wind from downbursts or detecting the speed of cold fronts. However, since the radar only measures radial velocity, the strength of the wind will always be less than what is actually occurring unless the wind is moving directly toward or away from the radar. Also, the surface winds are only for areas near the radar. As distance increases from the radar, the reported value will be for increasing heights above the earth's surface.
Storm Relative Velocity (SRV)
Storm Relative Velocity images are very useful images to look for small scale circulations (called mesocyclones) in thunderstorms. Often, these small scale circulations are areas where tornadoes form. What separates storm relative velocity from base velocity is the motion of storms are "subtracted" from the overall flow of the wind. As storms move, their own motion can mask circulations within themselves. This motion is removed to make the view of the wind relative to the storm. In effect, what is seen is the wind's motion as if the storms were stationary.
Spectrum Width (SW)
Spectrum width is the distribution of velocities within a single radar pixel. One pixel on radar represents a volume. Within this volume can be literally millions of individual hydrometeors. Each individual hydrometeor will have its own speed and direction of movement. When turbulence exists in the atmosphere, individual hydrometeors within the radar pixel volume have vastly different radial velocities.
In order to produce a pixel of radar velocity, the radar averages the individual radial velocities with a volume sample to produce a single average radial velocity that is displayed for that pixel. In a situation where shear and turbulence is small within a pixel, the spectrum width will be small. In a situation where shear and radial velocity is large within a pixel, the spectrum width will be large. A technical way of defining spectrum width is that it is the standard deviation of the velocity distribution within a single pixel.
Spectrum width can be used to locate the center pixel of a TVS. Within the center pixel of a TVS will be a large velocity distribution (near zero at one location within the pixel and strong inbound and/or strong outbound velocities within that same pixel). Variations in the velocity distribution within a pixel occur depending on if the center of circulation is in the exact center of a pixel or near the edge of a pixel. The large distribution of velocities lead to a large standard deviation of velocities and thus a large spectrum width. Besides in association with a mesocyclone, spectrum width will show a turbulent pattern near any shear axis (such as the change in wind speed and direction along a squall line).
Echo Tops (ET)
An echo top is the radar indicated top of an area of precipitation. Once the precipitation intensity drops below a threshold value as the radar beam samples higher elevations of a storm or precipitation region then the echo top is located. The cloud top will often extend above the echo top since clouds are more difficult to detect by radar.
Echo tops can be used to assess the intensity of a storm. The rule of thumb is that the higher the echo tops are in a storm then the stronger the updraft is that produced that storm. A stronger updraft makes convective wind gusts and large hail more likely. When there are several storms on radar, the ones with the higher echo tops may be the most likely ones to produce the most significant severe weather (convective wind gusts and hail).
Vertically integrated liquid (VIL)
Vertically integrated liquid is an estimate of the total mass of precipitation in the clouds. The measurement is obtained by observing the reflectivity of the air which is obtained with weather radar.
The VIL measurement is usually used in determining the size of prospective hail, the potential amount of rain under a thunderstorm, and the potential downdraft strength when combined with the height of the echo tops. When VIL values are high for longer periods of time, the storm may be a supercell.
One-hour Precipitation (OHP)
One-hour Precipitation is an image of estimated one-hour precipitation accumulation. It is used to assess rainfall intensities for flash flood warnings, urban flood statements and special weather statements.
Storm Total Precipitation (STP)
Storm Total Precipitation image is of estimated accumulated rainfall, continuously updated, since the last one-hour break in precipitation. This product is used to locate flood potential over urban or rural areas, estimate total basin runoff and provide rainfall accumulations for the duration of the event.
Differential Reflectivity (ZDR)
The Differential Reflectivity shows the difference in returned energy between the horizontal and vertical pulses of the radar. Differential Reflectivity is defined as the difference between the horizontal and vertical reflectivity factors in dBZ units. Its values can range from -7.9 to +7.9 in units of decibels (dB).
Positive values indicate that the targets are larger horizontally than they are vertically, while negative values indicate that the targets are larger vertically than they are horizontally. Values near zero suggest that the target is spherical, with the horizontal and vertical size being nearly the same.
The larger the particle, the more it contributes to the resulting reflectivity factor. Hence while raindrops are normally wider than they are tall which would tend to yield a positive ZDR value, a scattering of large hailstones in the same volume of air being observed will yield a ZDR value closer to 0, because the spherical shape of the larger objects contributes more to the final reflectivity value. If the base reflectivity product is indicating high dBZ values whereas differential reflectivity is returning values near zero, then the volume in question is likely filled with a mixture of hail and rain.
Correlation Coefficient (CC)
The Correlation Coefficient is defined as the measure of how similarly the horizontally and vertically polarized pulses are behaving within a pulse volume. Its values range from 0 to 1 and are unitless, with higher values indicating similar behavior and lower values conveying dissimilar behavior. The CC will be high as long as the magnitude or angle of the radar’s horizontal and vertical pulses undergo similar change from pulse to pulse, otherwise it will be low.
Correlation Coefficient serves well at discerning echoes of meteorological significance. Non-meteorological echoes (such as birds, insects, and ground clutter) produce a complex scattering pattern which causes the horizontal and vertical pulses of the radar to vary widely from pulse to pulse, yielding CC values typically below 0.8. Hail and melting snow are non-uniform in shape and thus cause a scattering effect as well, but these meteorological echoes have more moderate CC values ranging from 0.8 to 0.97. Uniform meteorological echoes such as found in rain and hail yield well-behaved scatter patterns, and their CC from pulse to pulse generally exceeds 0.97.
The accuracy of the Correlation Coefficient product degrades with distance from the radar. The CC will also decrease when multiple types of hydrometeors are present within a pulse volume, thus a volume with rain and hail will yield a lower CC than the same volume with solely rain.
Specific Differential Phase (KDP)
Differential phase shift in general (technically classified as propagation differential phase shift) is the difference between the horizontal and vertical pulses of the radar as they propagate through a medium such as rain or hail and are subsequently attenuated (slow down). Due to differing shapes and concentration, most targets do not cause equal phase shifting in the horizontal and vertical pulses. When the horizontal phase shift is greater than the vertical the differential phase shift is positive, otherwise it is negative. Stated differently, horizontally oriented targets will produce a positive differential phase shift, whereas vertically oriented targets product a negative differential phase shift.
Differential phase is dependent on particle concentration. That is, the more horizontally oriented targets are present within a pulse volume, the greater the positive differential phase shift. Thus a high concentration of small raindrops could yield a higher differential phase value than a smaller concentration of larger raindrops. Differential phase shifting is largely unaffected by the presence of hail, and shifts in snow and ice crystals are typically near zero degrees. Non-meteorological echoes (birds, insects, and so forth) produce highly variable differential phase shifts.
Specific Differential Phase (KDP) is defined as the range derivative of the differential phase shift along a radial. Its possible values range from -2 to 7 in units of degrees per kilometer. It is available in two resolutions: 8-bit at 1 degree x 0.25 km resolution and 4-bit at 1 degree x 1.0 km resolution. It is best used to detect heavy rain. Areas of heavy rain will typically have high KDP due to the size or concentration of the drops. Hail and snow/ice crystals have no preferential orientation and will yield KDP values near zero degrees. Non-meteorological echoes will result in noisy KDP values. KDP is not calculated for areas in which the Correlation Coefficient (CC) is less than 0.9, which will result in gaps in the rendered data.
Hydrometeor Classification Algorithm (HCA)
The HCA is a complex algorithm performed by the NEXRAD that attempts to determine the most likely type of the echoes in the radar beam. It combines several base moments (reflectivity, velocity, ZDR, CC, KDP) with the environmental data (the Melting Layer levels) to produce 10 hydrometeor types.
- HA - Hail
- GR - Graupel (soft ice, snow pellets)
- BD - Big Drops
- HR - Heavy Rain
- RA - Rain
- WS - Wet Snow
- DS - Dry Snow
- IC - Ice Crystals
- GC - Ground Clutter (buildings, trees)
- BI - Biological (birds, insects)
The Hydrometeor Classification product should be used in conjunction with other data for proper interpretation, as it is merely an algorithm and not an absolute indicator of what is occurring at a particular location. As currently implemented, the algorithm determines only the most likely type of hydrometeor, omitting information pertaining to the likelihood of other categories.
Digital One-Hour Difference (DOD)
Digital One-Hour Difference shows the difference between the dual-pol product and legacy product with no bias applied. The equation used is dual-pol minus legacy. Positive values indicate the dual-pol estimate is more than the legacy estimate while negative values indicate the legacy estimate is more than the dual-pol estimate.
Digital Storm Total Difference (DSD)
Digital Storm Total Difference shows the difference between the dual-pol product and legacy product with no bias applied. The equation used is dual-pol minus legacy. Positive values indicate the dual-pol estimate is more than the legacy estimate while negative values indicate the legacy estimate is more than the dual-pol estimate.
Data source: NOAA, theweatherprediction.com, RadarScope

.png "LanguageAL(1)")
")

.png "LanguageCZ(1)")
")
.png "LanguageDE(1)")
")
.png "LanguageDK(1)")
")
.png "LanguageEE(1)")

")
.png "LanguageFI(1)")
")

.png "LanguageFR(1)")
")
.png "LanguageGB(1)")
")
.png "LanguageGR(1)")
")
.png "LanguageHR(1)")

")
.png "LanguageIL(1)")

.png "LanguageIT(1)")
")
.png "LanguageJP(1)")

.png "LanguageLT(1)")

.png "LanguageNL(1)")
")
")
.png "LanguagePL(1)")
")
")

.png "LanguageRS(1)")

")

.png "LanguageSK(1)")
")